A 3D dashboard shows a company's data in a three-dimensional scene that moves in the browser. With three.js it can be done without installing anything and without paying per-user licences. We built one to run Lagunbot, and here we explain when 3D adds value, when it gets in the way and how it is put together inside.
- What a 3D dashboard is
- What three.js is and why we use it
- When 3D helps in a dashboard
- When it gets in the way
- The 3D dashboards we use to run Lagunbot
- How they are built inside
- What we learned building them
- An example for a client: a field service dashboard
- 2D or 3D dashboard: a comparison
- How to commission a custom dashboard
- Frequently asked questions about 3D dashboards
- Sources
What a 3D dashboard is
A 3D dashboard is a business dashboard in which a company's data is drawn on a three-dimensional scene: for example, a building with one room per department, or a factory floor with its production lines. It opens in the browser, you can rotate and zoom it, and it is fed from the same sources as an ordinary dashboard: spreadsheets, invoicing software, web analytics or the CRM.
Three different things get mixed together in searches.
- The 3D business-data dashboard. The indicators come first, and the scene is there to organise them and make them easy to scan.
- The digital twin, which reproduces a real physical site, such as a factory or a building, with its sensors. It needs 3D models of the place and plant data, and it is a different kind of project.
- The standalone 3D chart: the bar or pie chart with volume that some dashboard tools let you insert. It is a flat chart with relief and does not change how information is organised.
This article is about the first, and above all about its visual and technical side. Which indicators to include is covered in our guide to the business dashboard and its KPIs.
What three.js is and why we use it
three.js is an open-source JavaScript library for creating 3D graphics on a web page. According to its repository, the project aims to be an easy-to-use, lightweight, general-purpose 3D library that works across browsers. It is published under the MIT licence and current versions include both WebGL and WebGPU renderers. It is used for scenes and games, and also for 3D data visualisation on the web.
WebGL is the browser technology that allows 3D graphics to be drawn in a canvas element. Programming with it directly is slow and complicated. The library takes care of the hard part (cameras, lights, materials, objects and animation): the developer describes the scene and three.js draws it.
In a business project, that has practical consequences:
- Nothing needs to be installed. The dashboard opens from a link, on the office computer or on the meeting-room screen.
- With the MIT licence there is no cost per user or per dashboard that rises as more people join.
- It is all web code, so anyone who can program for the web can maintain it.
When 3D helps in a dashboard
After building several, we see three situations in which the third dimension is worth what it costs.
When there is a place or a structure to recognise
If the company can be seen as a set of spaces, a spatial metaphor helps each person find what is theirs. A building with one room for sales, another for invoicing and another for SEO can be explored without instructions, and nobody has to remember which tab each report was in.
When the overall picture matters
3D works well for seeing at a glance which part of the business is quiet and which needs attention. The colour and size of the objects give that quick reading, which is what you want at the start of the morning. To check a specific figure you need another view, as we explain below.
When the data has a location
Warehouses, routes, building sites and installations are somewhere in particular. If position is part of the decision, drawing it helps.
When it gets in the way
There are four cases in which 3D is surplus to requirements, and it is worth being clear about them before commissioning anything.
To compare figures exactly
To tell whether one figure is larger than another, the clearest option is a 2D bar on a shared axis. Perspective makes nearby things look bigger, and that distorts the comparison. Salesforce's Trailhead guide to data visualisation shows this with a 3D pie chart in which one slice looks smaller than it is. In our dashboards, the figures that matter are read in text and in tables, and the height of a cube is only there to help you get your bearings.
For people with visual or motor difficulties
A scene drawn in a canvas is not accessible on its own, because a screen reader does not know what is inside it. The WCAG accessibility guidelines (success criterion 1.1.1) ask for a text alternative for non-text content and, for data charts, also recommend providing the actual data in a table where possible. Continuous motion, for its part, bothers people with vestibular disorders. Anyone who needs to can ask for less motion in their device settings, and the page detects it with prefers-reduced-motion. A well-made 3D dashboard offers the text alternative and respects that preference.
On slow or heavily loaded machines
Drawing in 3D costs the computer more than drawing a table. On an old laptop, or on a machine with twenty programs open, the scene takes a while to appear and stutters. If the dashboard is going to be opened by people with very different equipment, that has to be considered from the design stage. The more animated objects on screen, the harder the graphics card works, so it is best to draw only what is necessary.
When an off-the-shelf tool already solves it
If what you need is sales by month, by salesperson and by product, a well-built spreadsheet or a standard dashboard tool is probably enough. A custom 3D build for that is money badly spent, and we will tell you so in the assessment.
If the question is "how much" or "which is bigger", use a 2D chart. If the question is "where is the thing that needs attention" or "how is everything going", 3D can help. Either way, a good 3D dashboard has the important numbers written out in text next to the scene.
The 3D dashboards we use to run Lagunbot
In October and November 2026 we built, with three.js, a set of dashboards to run our own company. They are our working tool, so we can say what works and what does not.
| Dashboard | Where the data comes from | What decision it supports |
|---|---|---|
| SEO | Search Console, Google Analytics 4, Bing Webmaster Tools and PageSpeed | Which pages to work on this week |
| Clients | Conversations from each client's assistants and CRM records | Which client needs attention and which is doing well |
| Sales funnel | Spreadsheets and notes from the three sales funnels | At which stage contacts get stuck |
| Invoicing | Exports from the invoicing software and a forecast of what is still to be invoiced | What has been collected, what is still to collect and what is being spent |
| Virtual office | The four above | A quick look at the state of the whole business |
The virtual office is the clearest example of a spatial metaphor: a 3D building in which each room is one of the other four dashboards. You walk in, see which room has an alert and move into it.
The data in these dashboards is internal and we do not publish it.
How they are built inside
The architecture has few pieces, and that is deliberate.
- The sourcesSpreadsheets, invoicing software, web analytics, assistant platforms and CRM notes. Each one keeps its data as it always has.
- Collector and bridgesA Python collector, which runs on our server, and Google Apps Script bridges read the sources every 30 minutes.
- A JSON fileThe result ends up in a tidy data file, with no business logic hidden in the display code.
- A static website with three.jsThe page reads the JSON and draws the scene. There is no database to query on each visit, so it loads quickly and is simple to maintain.
- Our own loginUsername and password on a login page we built ourselves. No per-user licences.
Reading the sources every 30 minutes was a deliberate choice. A real-time dashboard, with data that changes second by second, would need a different architecture: permanent connections to the server and sources that emit events. For decisions about sales, invoices or SEO, half an hour is plenty, and it makes everything much simpler and less prone to problems.
The login page is our own because the browser's built-in username and password window does not appear in some embedded browsers, and from those it was impossible to get in. With our page, you can get in from all of them.
What we learned building them
The important figures also go in text. When the computer is heavily loaded, the 3D scene takes a while to draw, and if the figure you want is only inside the scene, you are left waiting without knowing what is happening. That is why the main figures are now written separately, in ordinary HTML, and appear instantly.
The scene stops when nobody is looking at it. A continuous animation in a hidden tab wastes battery and processor for nothing. The dashboard stops drawing when the tab is not in view and starts again when you return.
If there is no API, use the exports. Not all invoicing programs have an API, and some charge extra for it. In those cases the dashboard is fed from the exports the program does allow, and it is updated by uploading the file. It is less elegant than an automatic connection, but it works today and does not depend on a paid extra.
An example for a client: a field service dashboard
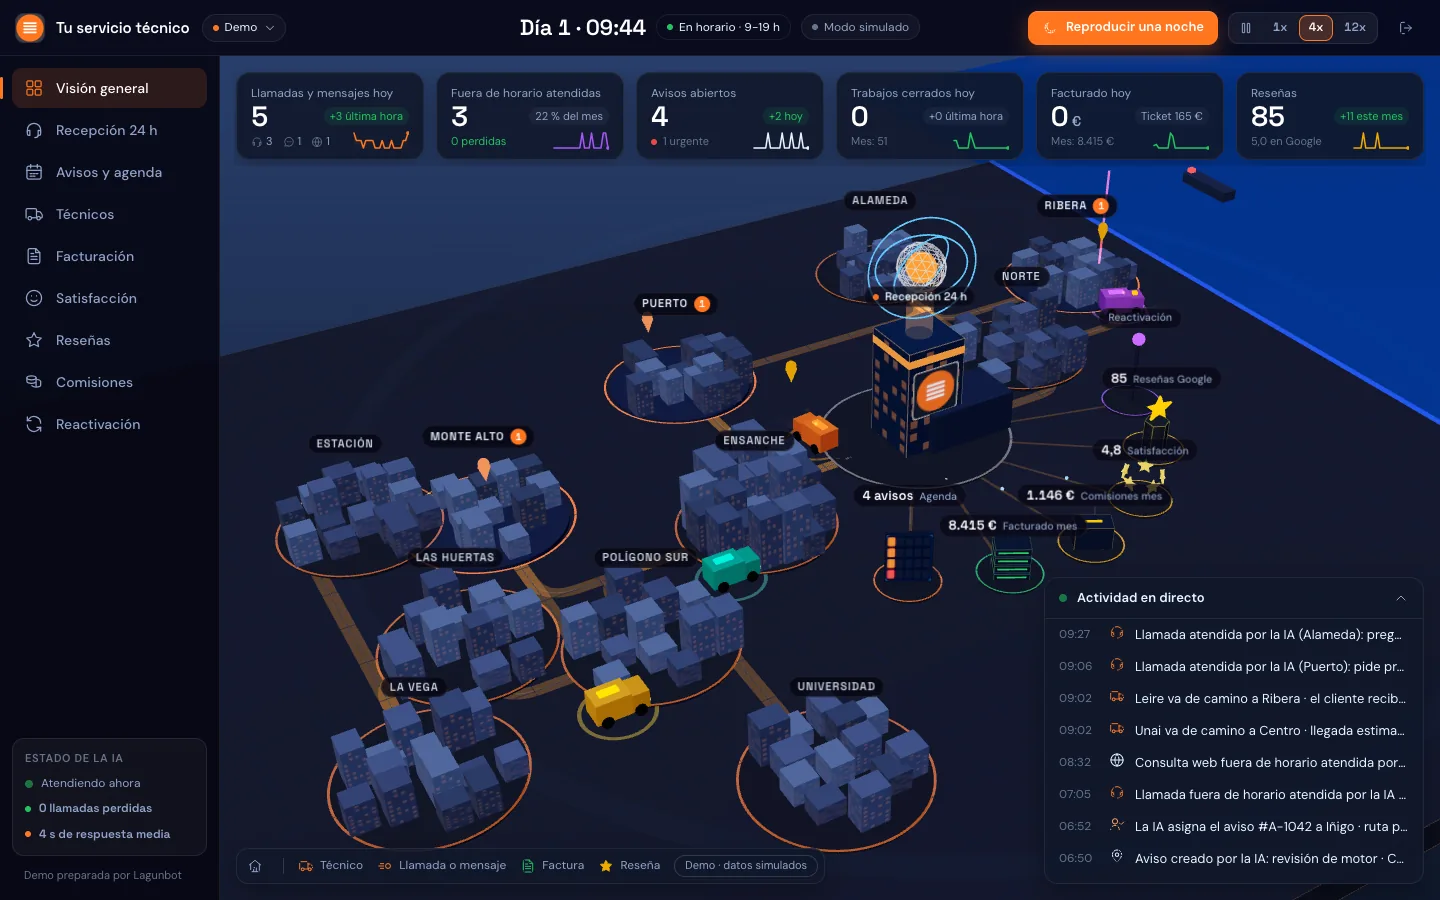
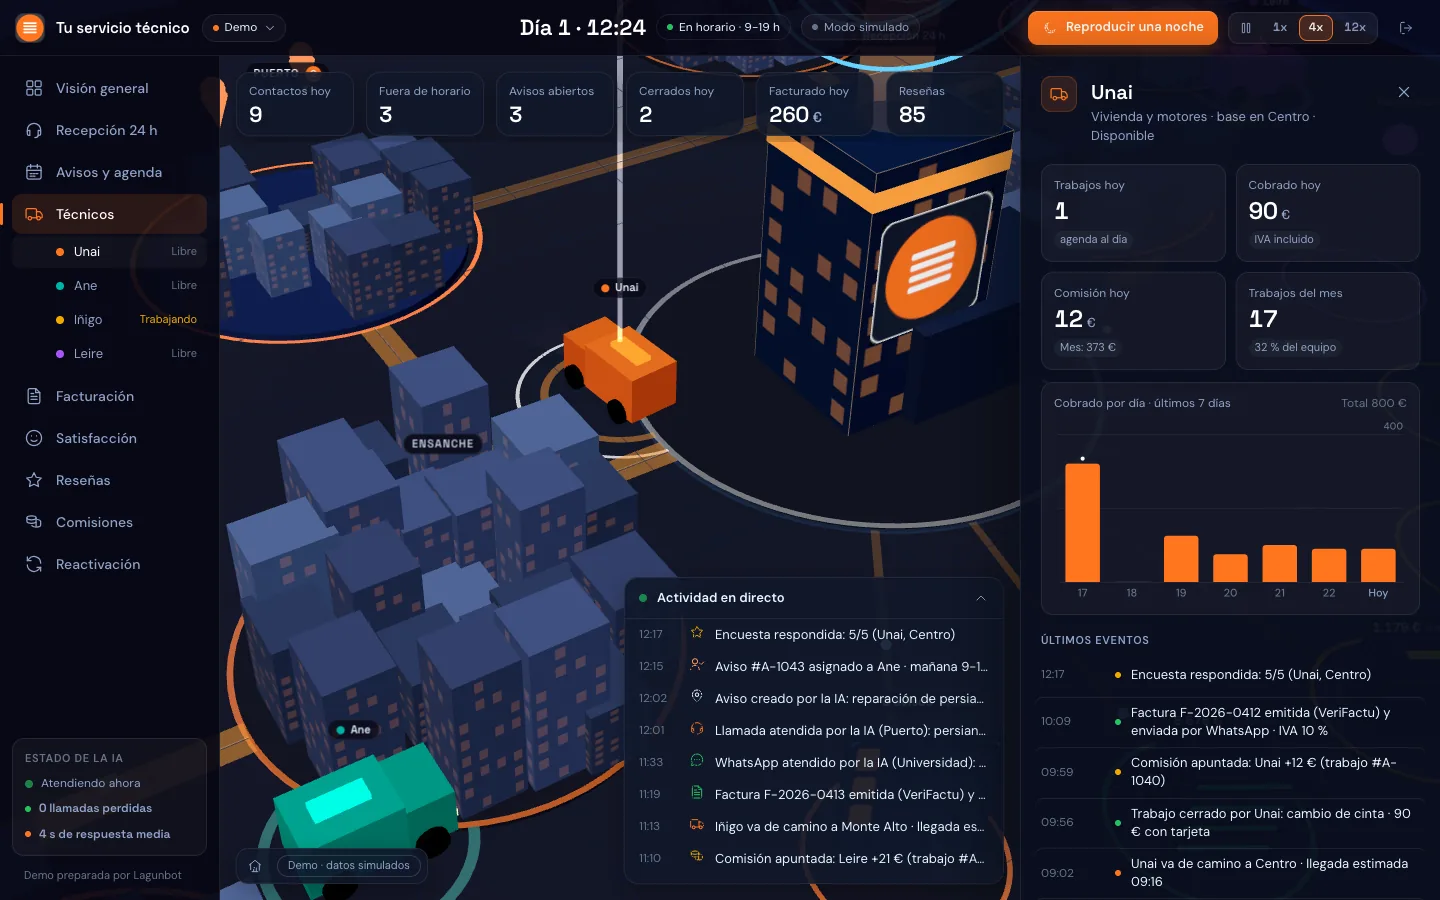
Besides our own dashboards, we have designed a 3D dashboard for a company that repairs and installs roller shutters. It is a working prototype with fictitious data and it is not in production at any client.
It follows the complete journey of a job: the customer's call-out request, the technician who receives it, the job sheet, the PDF invoice with a QR code, payment, the survey and the review. It has pages designed for the technician's phone and the customer's phone, a server of our own built with Python, FastAPI and SQLite, and a connected assistant that creates the call-out request by itself when the customer writes.
The dashboard draws that journey as a scene and, with the test data, it shows a client what they would see each morning. The complete system around it is described in the article on hyperautomation.
2D or 3D dashboard: a comparison
| 2D dashboard | 3D dashboard with three.js | |
|---|---|---|
| Comparing exact figures | Very good: bars, lines and tables | Poor: you have to rely on text and tables |
| Overall picture | Fine if there are few indicators | Very good with spatial metaphors |
| Meeting-room screen | Informative | Catches the eye and starts the conversation |
| Accessibility | Easier to solve | Needs equivalent text and tables, and respect for reduced motion |
| Older machines | No problem | Can run slowly |
| Licences | Depends on the tool; some charge per user | None per user with three.js (MIT licence) |
| Best when | The exact figure matters most | There is structure or place, or an overall view is needed |
The two options can be combined: a 3D entrance for getting your bearings and, once a room is chosen, tables and 2D bar charts for the detail.
How to commission a custom dashboard
A custom dashboard, whether 2D or 3D, turns out well when you decide what it has to show before drawing anything. This is the order we follow:
- The decisionsWhich decisions the team takes each week and which piece of data it is missing to take them. Without this, the dashboard ends up full of indicators nobody looks at.
- The sourcesWhere that data is today and how it can be read: API, export or spreadsheet.
- A prototypeA first version with a couple of indicators and real data, to decide whether 3D adds value or 2D is enough.
- Delivery in phasesAreas are added one at a time, starting with the one used most.
- MaintenanceSources change and programs get updated. Someone has to make sure the dashboard keeps reading correctly.
Before hiring anyone, ask who will own the code and the data, where the dashboard will be hosted and who pays for that hosting, and who will maintain it if a source changes. If the answers are put in writing, there are no surprises later.
This type of work is part of what we do in custom software development, alongside integrations and process automation with AI. If you are not sure whether you need a dashboard or whether the data needs tidying first, AI consulting starts right there, and how we work sets out the steps. We are based in Azpeitia and work with companies in Gipuzkoa, in the rest of the Basque Country and across Spain remotely.
Let's see whether your company needs a 3D or a 2D dashboard
In 30 minutes we go through which decisions you want to make with your data and tell you which format fits best, even if the answer is a spreadsheet. It is free and there is no obligation.
Request an assessment →Frequently asked questions about 3D dashboards
What is three.js?
It is an open-source JavaScript library, under the MIT licence, for drawing 3D graphics on a web page. It builds on WebGL and WebGPU, two browser technologies, and saves you from programming cameras, lights and materials at a low level.
Is a 3D dashboard the same as a real-time dashboard?
Not necessarily. Whether it is 2D or 3D and how often it updates are separate decisions. Our dashboards update every 30 minutes, and that is enough for decisions about sales, invoicing or SEO. A real-time dashboard, with data to the second, is designed differently and is only worth it if you genuinely have to decide within that timeframe.
Do I need to install anything to view it?
No. It opens in the browser with a link and a username. It works on current computers and meeting-room screens. On phones and older machines it should be tested first and, if necessary, a lighter view offered.
Is a 3D dashboard accessible?
It can be, if it is designed for it. The important figures are also written in text and in tables, the scene respects the system's reduced-motion preference and there is an alternative view without 3D. A 3D scene on its own, with nothing else, is not accessible.
Can it be connected to my current programs?
It depends on what each program offers. If it has an API, it is read directly; if it has none or charges extra for it, we work with its exports. We have connected spreadsheets, Google Search Console and Analytics, invoicing software and AI assistant platforms.
How much does a custom dashboard cost?
It depends on the number of sources, the areas it covers and whether it needs 3D or 2D will do. That is why we do not publish prices: after the free 30-minute assessment we send a written proposal tailored to you.
Is it suitable for a small company?
Yes, if there are decisions that are made with data spread over several places. In a small company, what you gain is not having to open five programs every morning. Sometimes the first step is a well-organised spreadsheet, and that is enough.
Who maintains the dashboard when a data source changes?
Whoever is agreed in writing when you commission it. Programs change their exports and their APIs, so you need to settle from the start who keeps watch, how a failure is reported and how long a repair takes. We set this out in the proposal.