A business dashboard is a single screen that brings together the few indicators that show how the company is doing, and where the data comes from, so you can decide without opening ten programs. This guide explains what to include by area, shows the five dashboards we use to run Lagunbot and compares Excel, Power BI and Looker Studio with a custom-built one.
- What a business dashboard is and what it is for
- Business dashboard, KPI dashboard and balanced scorecard
- Which KPIs to put on a dashboard, by area
- A business dashboard example: the five dashboards we use to run Lagunbot
- Excel, Power BI, Looker Studio or a custom-built dashboard
- Real-time dashboard: when you really need one
- How to build a dashboard, step by step
- Common mistakes
- Frequently asked questions about business dashboards
- Sources
What a business dashboard is and what it is for
A business dashboard is a screen that gathers the company's key indicators (the KPIs) in one place, with data that updates itself or needs very little manual work. Its job is to answer, every week and without going from program to program, questions such as how much we have sold, what we are owed, which customers are going cold or where our enquiries come from.
You will also hear it called a KPI dashboard, a management dashboard or a control panel. They all mean the same thing: a few well-chosen numbers that someone looks at regularly and that lead them to do something.
For a dashboard to work, it has to meet three conditions.
- It answers questions that lead to a decision. Each indicator is there because, if it moves, someone acts: calls a customer, changes a price list or divides the work up differently.
- It is fed by real data. If someone has to copy figures by hand every week, sooner or later it stops being updated.
- Someone looks at it. It has an owner and a fixed time for review, such as the Monday meeting.
Business dashboard, KPI dashboard and balanced scorecard
In practice, "business dashboard" and "KPI dashboard" are used as synonyms. Both mean that screen with charts and figures.
The balanced scorecard is a different management model. Robert Kaplan and David Norton presented it in the Harvard Business Review, in the January-February 1992 issue. It proposes looking at the company from four perspectives: financial, customer, internal processes, and innovation and learning, which is now usually called learning and growth. Its aim is to turn strategy into measurable objectives.
For an SME, the difference lies in how it is used. The dashboard we describe in this article is operational and tells you what is happening this week. The balanced scorecard is strategic and management reviews it less often. One idea from the balanced scorecard is worth borrowing, which is not to look only at money, and we apply it below when choosing indicators.
Types of dashboard
Each author classifies them differently. Almost all distinguish at least two levels and some add a third.
- Operational. Tracks the day-to-day of an area: open tickets, orders, new enquiries. It is checked daily or weekly.
- Tactical or analytical. A department head uses it to compare periods and see where a process gets stuck.
- Strategic. Keeps an eye on the company's long-term objectives. The balanced scorecard fits here.
An SME usually starts with the operational one, because it is the one that changes the week's work.
Which KPIs to put on a dashboard, by area
There is no list that suits every company: it depends on the trade and on what each area has to decide. These are common indicators in an SME, and the sensible approach is to keep two or three per area.
Sales and pipeline (sales dashboard)
A sales dashboard answers one question: is enough work coming in, and is it being closed?
- New enquiries per week and the channel they arrive through.
- Enquiries moving from one stage to the next: first reply, meeting, proposal sent, won, lost.
- Open proposals and how long they have gone without a reply. This tells you who to call today.
- Reasons for lost deals, always recorded from the same short list.
Invoicing and cash collection forecast
- Invoiced, collected and spent in the period.
- Overdue invoices and those falling due in the next few weeks.
- Work done but not yet invoiced. It is often forgotten, and it is money already earned.
- Income forecast for the coming months, based on what is already contracted.
Customers and service
- Enquiries handled and, if you use an assistant, how many are resolved without a person stepping in.
- Time to first response.
- Open issues and average time to close.
- Customers who have not written or bought again within the period that would be normal in your business.
- Ratings and reviews, and what customers who leave say.
Marketing and SEO
- Website visits by source: search engine, social media, email, direct.
- Impressions, clicks and average position in Google Search Console for the searches that matter to the business.
- The pages that bring in the most enquiries, which are not always the most visited.
- Forms submitted and calls that come from the website.
A dashboard with well-chosen KPIs fits on one screen. If you have to scroll three times to see all of it, there are too many indicators.
Ask yourself what you would do if the number doubled or collapsed tomorrow. If the answer is "nothing", remove it.
A business dashboard example: the five dashboards we use to run Lagunbot
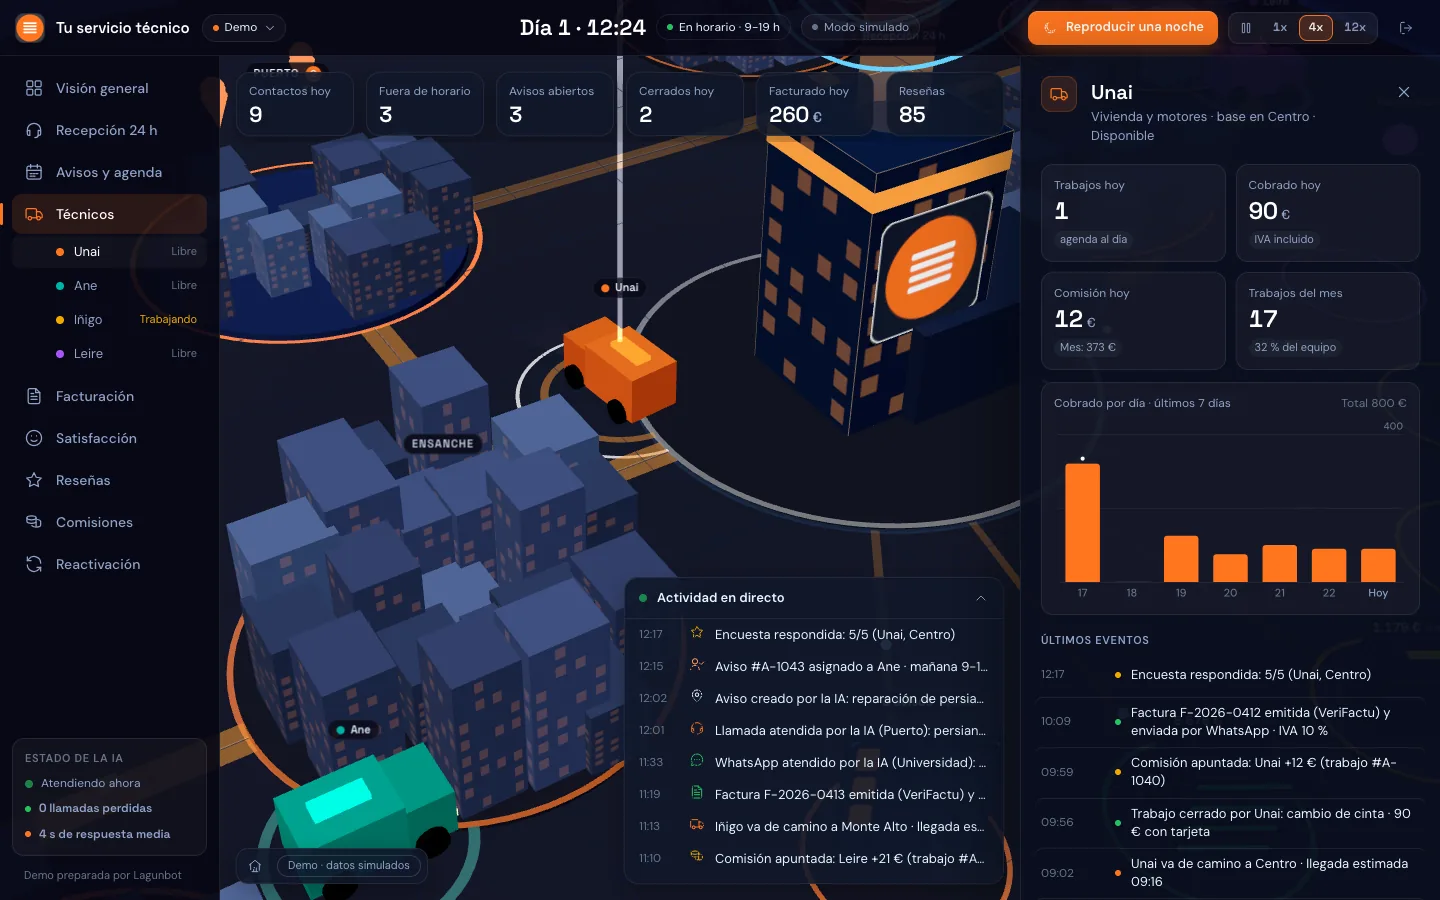
Many of the business dashboard examples you find online are templates with made-up data. The one we show below is real and we use it ourselves: between October and November 2026 we built five dashboards with three.js to run Lagunbot, all with private access. The figures are internal, so we explain where each dashboard gets its data and what decision it lets us make.
| Dashboard | Where the data comes from | What decision it supports |
|---|---|---|
| SEO | Search Console, Google Analytics 4, Bing Webmaster Tools and PageSpeed | Which pages to strengthen, which searches have demand but get no clicks, and whether a technical improvement has worked |
| Customers | Conversations from each customer's assistants and the CRM records | Which customer to review this month, whether use of their assistant is rising or falling and what is pending for each |
| Sales pipeline | Spreadsheets and notes holding the three sales pipelines | Who to write to today, which proposals have been waiting days for a reply and which pipeline needs more enquiries |
| Invoicing | Exports from the invoicing program and the forecast of work still to be invoiced | What to collect first and what work remains to be invoiced |
| Virtual office | The four above | An overview for the team meeting, with one room per department |
How they are fed
A collector written in Python, running on our own server, and some Google Apps Script bridges read the sources every 30 minutes and leave the data in a JSON file. The website is static: it reads that file and draws it. Because it is our own website, we pay no per-user licences.
The invoicing dashboard works differently. If an invoicing program has no API, or charges extra for it, you have to use its exports, and that is what we do: the dashboard is updated when we upload the exported file. It is a manual step that we accept because the data that arrives is reliable.
What we learned
- The important numbers go in text as well. If the computer is under heavy load, the 3D scene takes a while to draw, and meanwhile the person looking at it needs to see the figure.
- The username and password are requested on our own login page, because the browser's password window does not appear in some embedded browsers.
- You do not need to wait for the perfect integration to have a dashboard. A periodic export already gives you data to decide with.
- The dashboard only shows what is in its sources. The pipeline is read from spreadsheets and notes, so whatever nobody writes down does not appear.
For most business dashboards, plain old 2D charts are enough. We explain when 3D makes sense in our article on the 3D dashboard with three.js.
Excel, Power BI, Looker Studio or a custom-built dashboard
Before commissioning anything custom, see what an off-the-shelf tool already does, because often it is enough.
| Excel or spreadsheets | Power BI | Looker Studio | Custom-built | |
|---|---|---|---|---|
| When it is enough | A few indicators and one person to update it | Data in several tables and a team that already works in the Microsoft environment | Most of the data is in Google products | The sources vary, there are business rules of your own or you want it to update itself |
| Sources | Whatever you paste or import | Excel, databases, web services and more | Spreadsheets, Search Console, Analytics and others | Whichever you need, including an old program or one with no API |
| Updating | By hand or with macros | Scheduled from its online service | From its connectors | Each piece of data at the frequency the decision it supports calls for |
| Weak point | Breaks when the sheet changes and depends on one person | You have to learn its data model and, to share, publish to its online service | Little room for your own logic | It has to be maintained and depends on a supplier |
According to each tool's official documentation, Power BI Desktop is a free Microsoft application for Windows that imports data from Excel, databases and web services; to share reports you have to publish them to its online service. Looker Studio, from Google, has Google Sheets, Search Console and Google Analytics among its official connectors.
Our advice: if your data is in an Excel file and in Google Analytics and you are going to look at four indicators, use Looker Studio or a well-built spreadsheet. A custom-built dashboard pays off in other cases:
- The data is spread across programs that do not talk to each other and someone puts it together by hand.
- There are business rules that no standard tool applies, such as commissions, prices by area or sector-specific VAT rules.
- As well as showing the number, you want the system to do something: alert a person, prepare an email or open a task.
- You want to decide where the data is stored and not pay for every person who looks at the dashboard.
For those cases we build custom software, dashboards included. If you are not sure whether you need it, we go through it with you in an AI consulting session, and sometimes the answer is that you do not.
Real-time dashboard: when you really need one
A real-time dashboard shows data almost the moment it happens. In an SME you need it less often than it seems. To find out whether you do, think about how much time can pass between something happening and someone having to react.
- A website outage or a fault in an installation: you have to react within minutes, so here it does make sense.
- A customer waiting in a conversation for a person to take over: again, we are talking minutes.
- The day's sales or new enquiries: checking them every hour or every day is enough.
- Invoicing and collections: every day or every week.
- SEO: every day, because rankings do not change from one minute to the next.
Our dashboards read their sources every 30 minutes (except invoicing) and that is enough for us to decide without maintaining anything complicated. Strict real time adds complexity and maintenance cost, so it is best kept for what cannot wait. If you commission a custom dashboard, give priority to the data arriving on its own over seeing it to the second.
How to build a dashboard, step by step
- Decide who will look at it and whenA specific person and a fixed appointment, such as the Monday meeting or the end-of-week close. If nobody is assigned to look at it, the rest of the work is of little use.
- Write down the questionsBetween five and ten. "Who do I have to call today?", "How much am I owed?", "Which service takes longest to respond?"
- Choose one indicator per questionWith its formula written down: what it counts, from when and what is left out. If two people calculate it, they must arrive at the same number.
- Find the source of each piece of dataWhich program stores it, who records it and whether it can be read automatically, through an API, or has to be exported.
- Tidy the data before drawing anythingThe stages of an enquiry, product names and dates have to be written the same way every time. This is usually the part that takes the longest.
- Start with the simplest versionA spreadsheet or an off-the-shelf tool. If after a few weeks it is in use and falls short, then something custom makes sense.
- Review after a few weeksRemove what nobody looks at, add what people keep asking for by hand and check that the numbers match reality.
Connecting the sources and automating the data load is a job for AI automation for SMEs. If the dashboard is part of something bigger, such as a system that automates several parts of the business, we explain it in our article on hyperautomation.
Common mistakes
- Too many indicators. With everything on screen it is hard to see what matters. It is the most common failing, and Kaplan and Norton were already pointing it out in 1992: companies rarely suffer from having too few measures.
- Data entered by hand. It works at first and then gets abandoned. If it cannot be automated, let it at least be an export rather than copying and pasting cell by cell.
- Nobody looks at it. A dashboard with no meeting attached to it ends up as decoration.
- Different definitions. An "active customer" cannot mean one thing to sales and another to administration.
- Looking only at money. What has been invoiced arrives late; enquiries, open proposals and service give warning earlier.
Let's talk about your dashboard
In 30 minutes we look at which decisions you want to make, where your data comes from and whether an off-the-shelf tool is enough or something custom makes sense. The video call is free and commits you to nothing.
Request an assessment →Frequently asked questions about business dashboards
What is a business dashboard?
It is a screen with the business's key indicators (sales, collections, customers, marketing) fed by the company's real data. It lets you decide at a glance, without opening each program separately.
What is the difference between a dashboard and a balanced scorecard?
An operational dashboard shows how the business is doing this week. The balanced scorecard, presented by Kaplan and Norton in 1992, is a model for turning strategy into measurable objectives from four perspectives: finance, customers, internal processes, and innovation and learning. The first is reviewed often; the second is reviewed by management at longer intervals.
How many KPIs should a dashboard have?
As many as fit on one screen and help you decide. As a guide, two or three per area. If you do not know what you would do on seeing an indicator rise or fall, leave it out.
Can you build a dashboard in Excel?
Yes, and it is often a good idea to begin with. It works well with a few indicators and one person to update it. It starts to fail when there are several sources, the sheet changes shape or copying the data takes more time than the dashboard saves.
When is a custom-built dashboard worth it?
When your data is spread across programs that are not connected, when there are rules specific to your business that standard tools do not apply or when you want the dashboard, as well as showing data, to alert people or carry out tasks. If an off-the-shelf tool solves it, use it.
What is a real-time dashboard and when do you need one?
It is a dashboard that updates almost instantly. You need it when someone has to react within minutes, for example to a website outage or a customer who is waiting. For sales, collections or SEO, refreshing every hour or every day is enough, and it is simpler to maintain.
Does a 3D dashboard make sense?
Yes, as an overview or on the screen of a meeting room. To compare exact figures, a 2D chart works better. We explain it in more detail in our article on the 3D dashboard with three.js.
What do you need to start a dashboard?
A person in charge, between five and ten questions you want to answer and knowledge of where each piece of data is stored. With that you can already build a first version. If you would like us to go through it together, request a 30-minute assessment.